Using the Application/Graphical User Interface (GUI)
This is a guide on how to use the Graphical User Interface (GUI). The GUI is a user-friendly version to run aggregation instead of the command line.
Download your data from the project builder
You will need two to three files from your project for offline use:
The classification dump: The
Request new classification exportorRequest new workflow classification exportbutton from the lab’sData ExporttabThe workflow dump: The
Request new workflow exportbutton from the lab’sData ExporttabThe workflow contents (optional): The
Request new workflow contents exportbutton from the lab’sData Exporttab. This file is used to make a look up table between the column names used for each task/answer/tool and the original text used for them on the project.
Example: Penguin Watch
Penguin Watch has several workflows, for this example we will look at workflow number 6465 (time lapse cameras) and version 52.76. The downloaded files for this project are:
penguin-watch-workflows.csv: the workflow file (contains the major version number as a column)penguin-watch-classifications-trim.csv: the classification file for workflow 6465
This zip folder contains these files.
Launching the GUI
If you have the standalone application downloaded, simply double click the .exe file (Windows) or .app file (MacOS) to launch the GUI.
If you have panoptes_aggregation installed, open a terminal and type:
panoptes_aggregation_gui
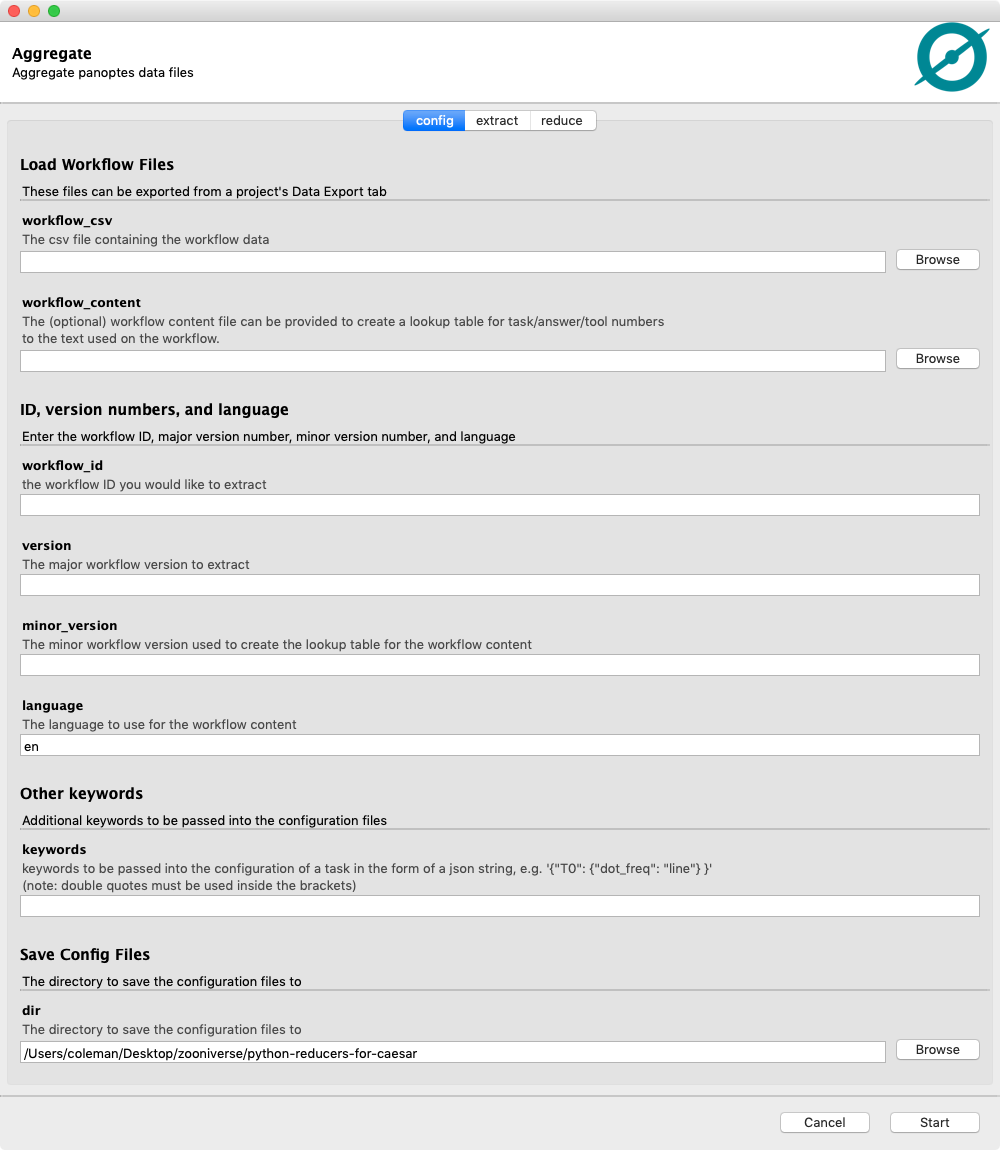
There are three tabs at the top of the GUI for switching between config, extract, and reduce.
Configure the extractors and reducers
The config tab is used to make configuration yaml files that are used to set up the extractors and reducers. These base files will use the default settings for various task types. They can be adjusted if the defaults are not needed (e.g. you don’t need to extract all the tasks, or you need more control over the reducer’s settings).
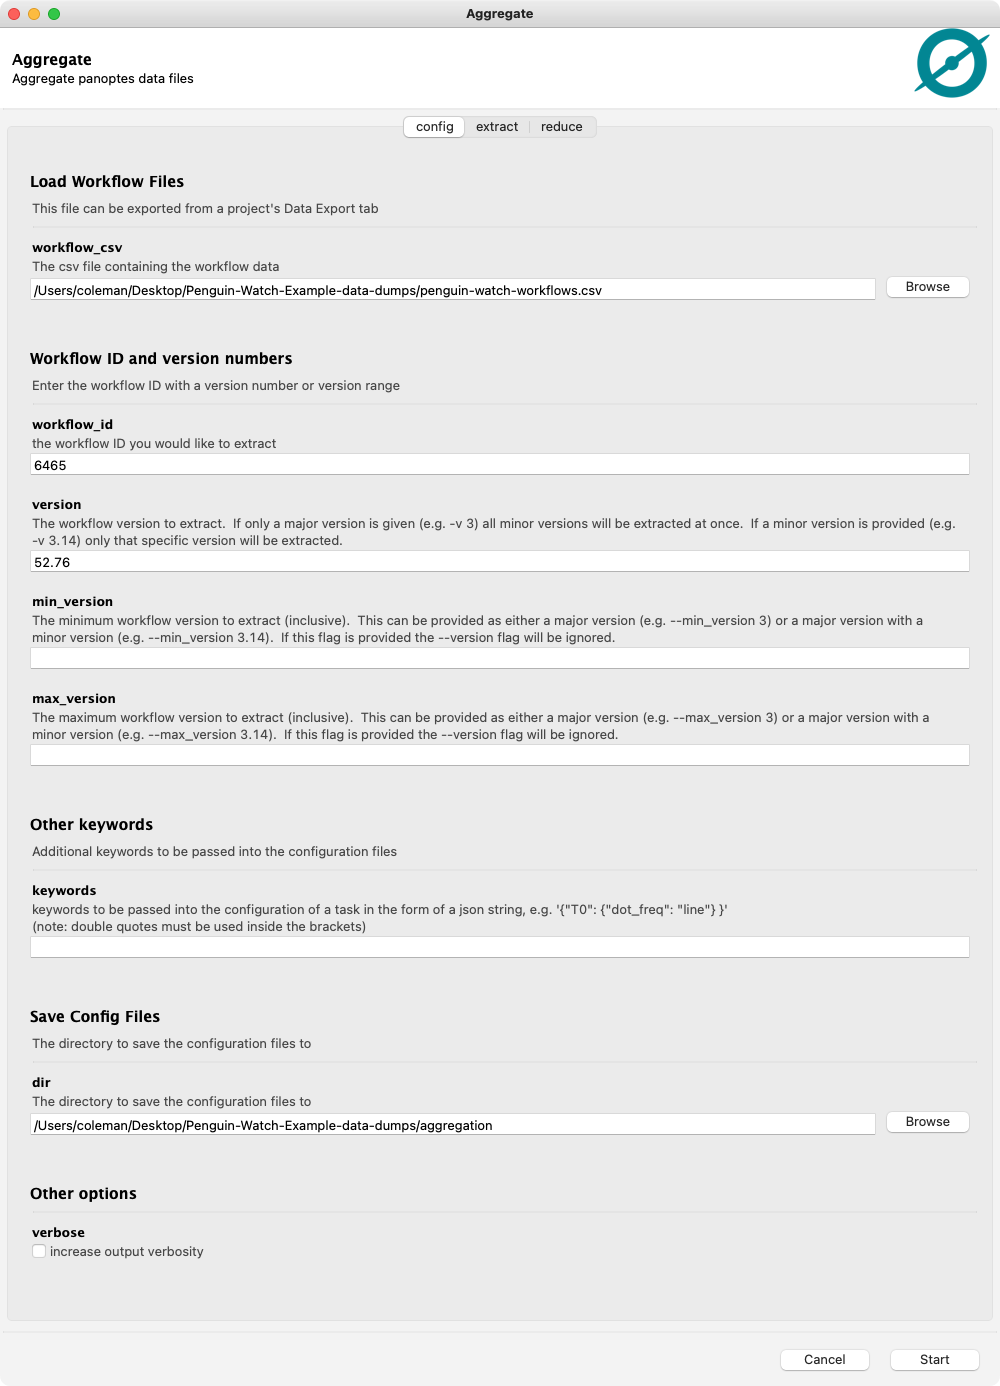
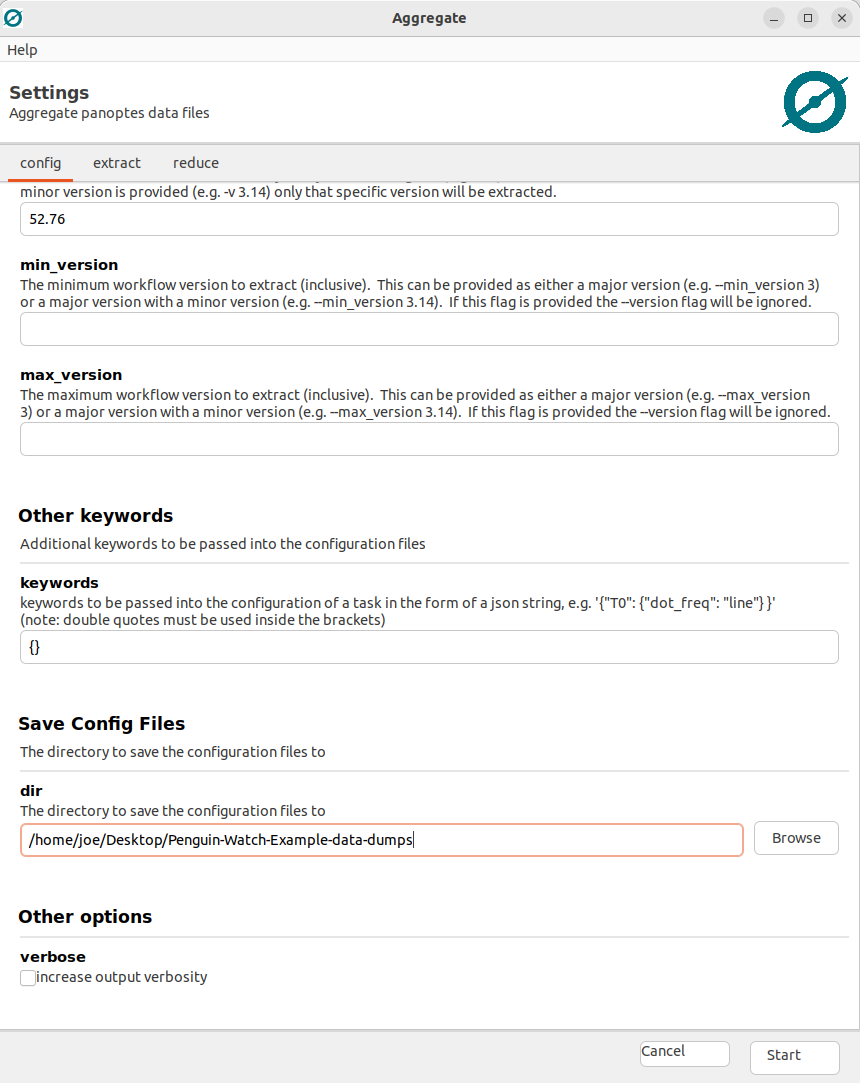
Example: Penguin Watch
We want to configure files for workflow 6465 v52.76. Enter this information into the GUI, along with the directory to save the files, and click the start button:
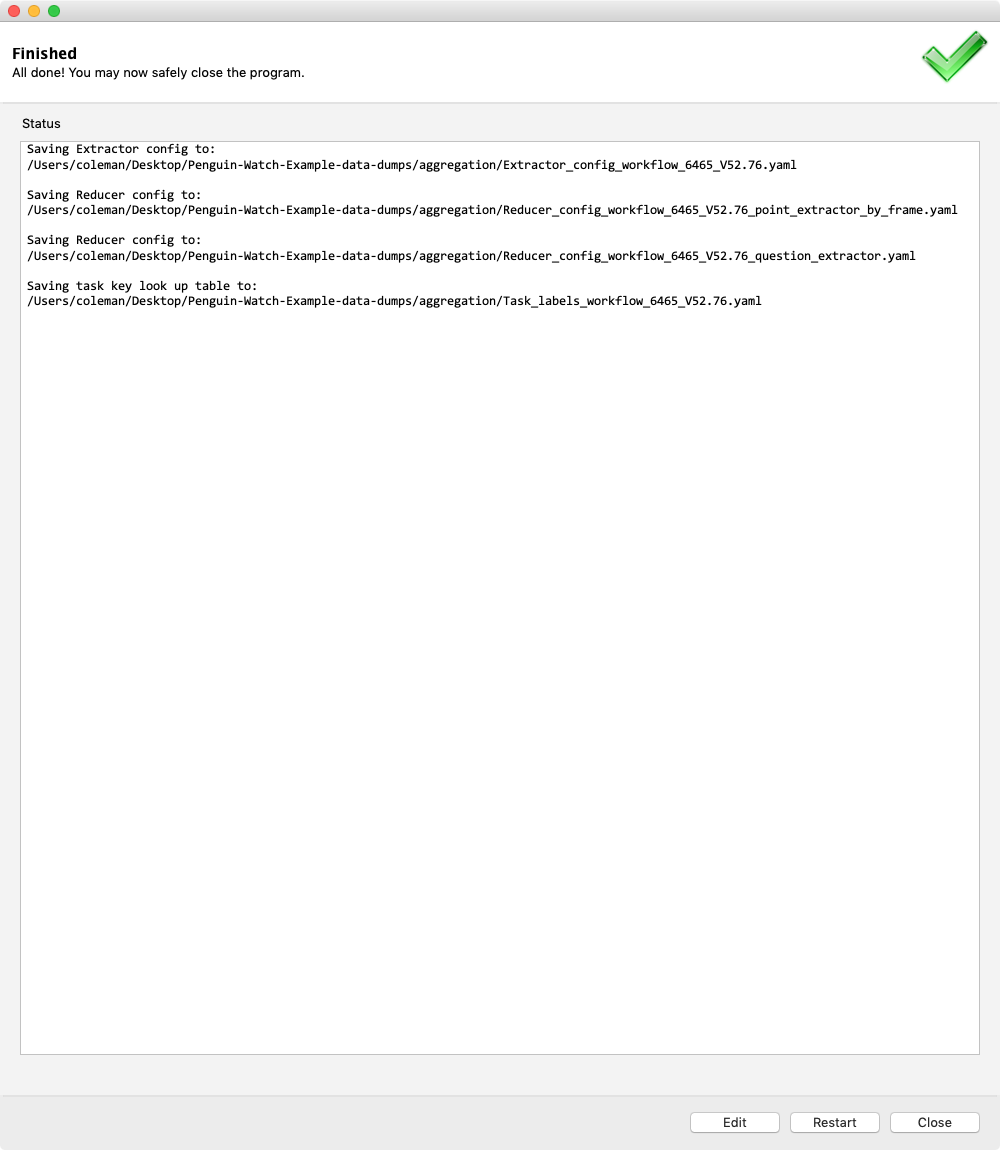
We can see this created five yaml files in our chosen output directory:
Extractor_config_workflow_6465_V52.76.yaml: The configuration for the extractor codeReducer_config_workflow_6465_V52.76_point_extractor_by_frame.yaml: The configuration for the reducer used for the point taskReducer_config_workflow_6465_V52.76_question_extractor.yaml: The configuration for the reducer used for the question taskReducer_config_workflow_6465_V52.76_shortcut_extractor: A simple question task that leads to a shortcut of any of the following tasksTask_labels_workflow_6465_V52.76.yaml: A lookup table to translate the column names used in the extractor/reducer output files into the text originally used on the workflow
Click the Edit button to go back to the previous screen.
Extracting data
Note: this only works for some task types, see the documentation for a full list of supported task types.
The extract tab will extract your data into one flat csv file for each task type.
Example: Penguin Watch
Before starting let’s take a closer look at the extractor configuration file Extractor_config_workflow_6465_V52.yaml:
extractor_config:
    point_extractor_by_frame:
    -   details:
            T0_tool3:
            - question_extractor
        task: T0
        tools:
        - 0
        - 1
        - 2
        - 3
    question_extractor:
    -   task: T1
    shortcut_extractor:
    -   task: T6
workflow_id: 6465
workflow_version: '52.76'
This shows the basic setup for what extractor will be used for each task. From this configuration we can see that the point extractor will be used for each of the tools in task T0, tool3 of that task will have the question extractor run on its sub-task, and a question extractor will be used for tasks T1 and T4. Task T6 is the shortcut task. If any of these extractions are not desired they can be deleted from this file before running the extractor. In this case task T4 was on the original workflow but was never used on the final project, I have already removed it from the configuration above.
Note: If a workflow contains any task types that don’t have extractors or reducers they will not show up in this config file.
This extractor configuration file can be used along with the classification data to make the extracted csv files:
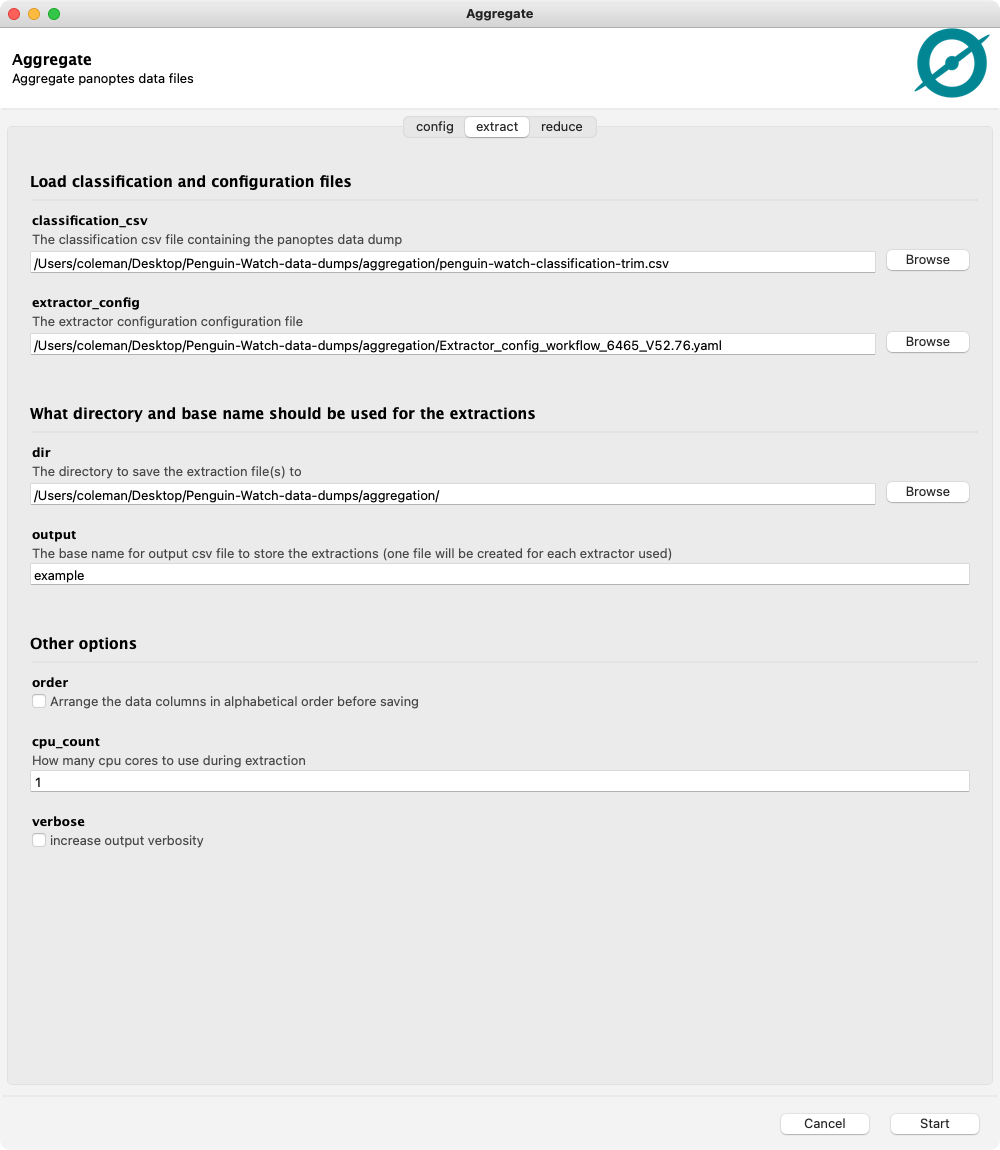
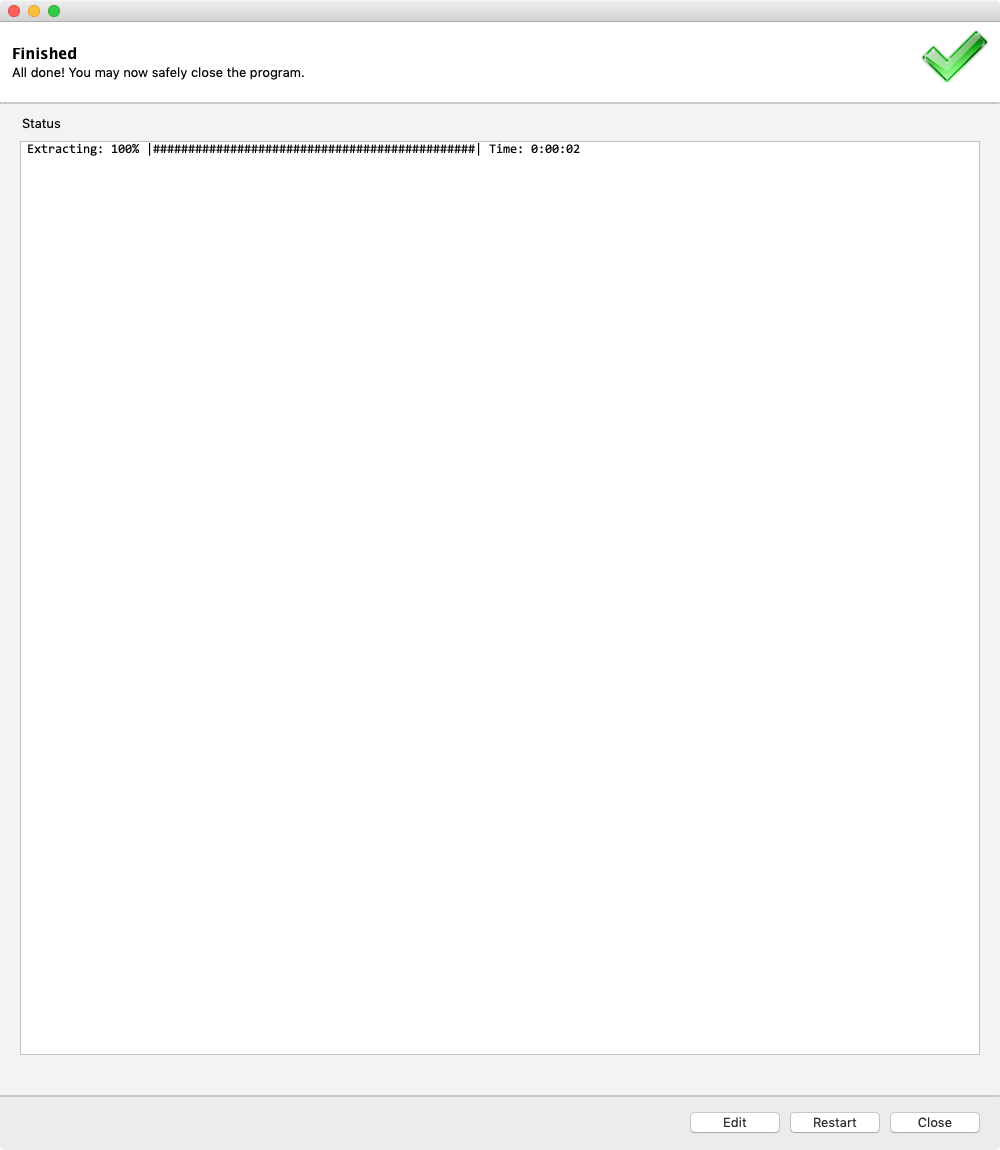
This creates three csv files (one for each extractor listed in the config file):
question_extractor_example.csvpoint_extractor_by_frame_example.csvshortcut_extractor_example.csv
Click the Edit button to go back to the previous screen.
Reducing data
Note: this only works for some task types, see the documentation for a full list of supported task types.
The reduce tab will reduce the extracts by subject_id into a consensus aggregation.
Example: Penguin Watch
For this example we will do the point clustering for the task T0. Let’s take a look at the default config file for that reducer Reducer_config_workflow_6465_V52.76_point_extractor_by_frame.yaml:
reducer_config:
    point_reducer_dbscan:
        details:
            T0_tool3:
            - question_reducer
As we can see, the default reducer is point_reducer_dbscan and the only keyword specified is the only associated with the sub-task of tool3. To get better results we will add some clustering keywords to the configuration of DBSCAN:
reducer_config:
    point_reducer_dbscan:
        eps: 5
        min_samples: 3
        details:
            T0_tool3:
            - question_reducer
But for this project there is a large amount of depth-of-field in the images, leading to a non-constant density of point clusters across the images (more dense in the background of the image and less dense in the foreground). This means that HDBSCAN will work better:
reducer_config:
    point_reducer_hdbscan:
        min_cluster_size: 4
        min_samples: 3
        details:
            T0_tool3:
            - question_reducer
Point the GUI to the extraction file and the configuration file to reduce the data:
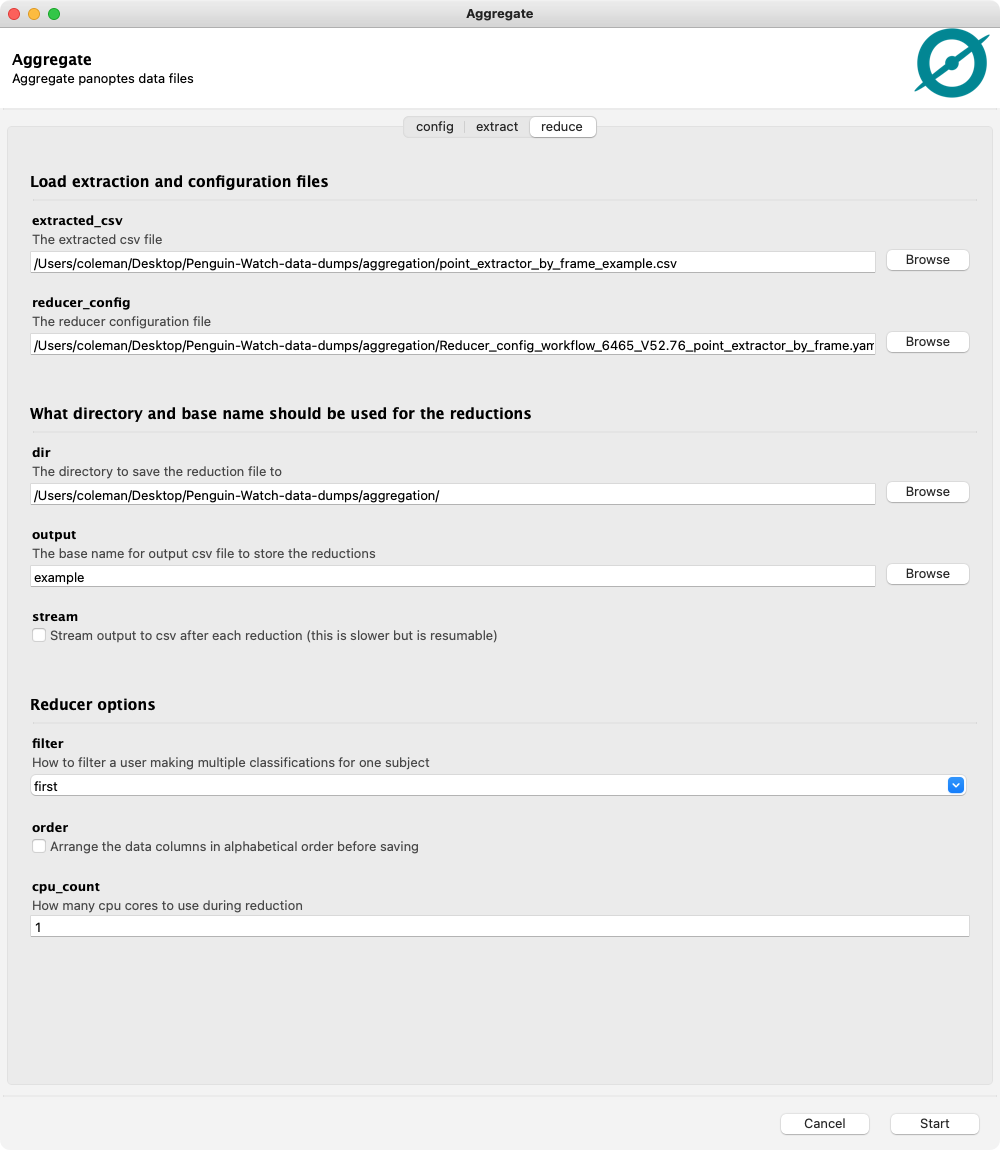

This will create one file:
point_reducer_hdbscan_example.csv: The clustered data points for taskT0
Reading csv files in python
The resulting csv files typically contain arrays as values. These arrays are read in as strings by most csv readers. To make it easier to read these files in a “science ready” way a utility function for pandas.read_csv is provided in panoptes_aggregation.csv_utils:
import pandas
from panoptes_aggregation.csv_utils import unjson_dataframe

# the `data.*` columns are read in as strings instead of arrays
data = pandas.read_csv('point_reducer_hdbscan_example.csv')

# use unjson_dataframe to convert them to lists
# all values are updated in place leaving null values untouched
unjson_dataframe(data)